Raster and Vector Data
and why it's beginning to matter to mappers...
At a recent course on Ocad 11 one early query was, "What's the difference between vector and raster data?" Good question, and one that becomes pertinent as cartographic software grows ever more sophisticated. So here goes:
Most of the images we see every day on the internet are raster files - simply pixel maps. Basically they're data grids which determine which pixel displays what colour. They're of different sizes and in different file formats. The best known are JPEGs (from Joint Photographic Experts Group) which usually have a .jpg file extension. You'll also come across TIFFs, PNGs, GIFs, BMPs, Uncle Tom Cobley and all.
As they're made of pixels, you can examine these files closely in an image-editing program like PhotoShop or PaintShop Pro. Zoom in and you see every individual square. This means it's possible to change pixels singly or en masse and create all sorts of interesting effects, as everyone who's tempted to tweak imperfect photos well knows!
Digital photos are invariably JPEGs, pixel grids with up to 16 million colours. Camera manufacturers usually quote their size in megapixels - for example, 3664 x 2748 = 10.1 million pixels. The bigger the photo, the bigger the file. To limit filesize, JPEGs use 'lossy compression': the algorithm for the file loses some nonessential data - a trade-off between size and quality. It does mean though, that if you keep changing and resaving a JPEG it gradually loses definition. Eventually it'll be a very poor distortion of the original.
Other file formats work differently. GIFs, for instance, are small simple images with up to 256 colours and without lossy compression. They're ideal for things like logos and cartoons but suffer when resized, as individual pixels are duplicated or destroyed. A ragged mess is just a few keystrokes away! Knowing what format to use when can be difficult.
Vector files aren't really images at all: they're instruction sets for drawing objects. They're a blueprint for points, lines, polygons and usually other shapes like ellipses and text. As well as 2D or 3D geometric information they contain data for attributes like colour. And because they're not comprised of pixels, they're not deformed by zooming in. They are the building blocks of GIS (Geographic Information Systems) and, importantly for orienteers, of cartographic software like Ocad and similar open source programs.
GIS programs work by building layers, each containing different data, superimposed on top of a basemap. Layers can be switched on or off so you view what you're interested in. The programs must also be able to convert vector files (and other kinds of raw data) into raster images so they're visible. After all, if vector files weren't somehow rasterised, no pixels would be lit up!
Ocad is a good example of raster data underpinning vector. The basemap templates - OS maps, satellite photos, Lidar contours etc - are raster images. The map drawn on top is a vector file which is rasterised for viewing and printing.
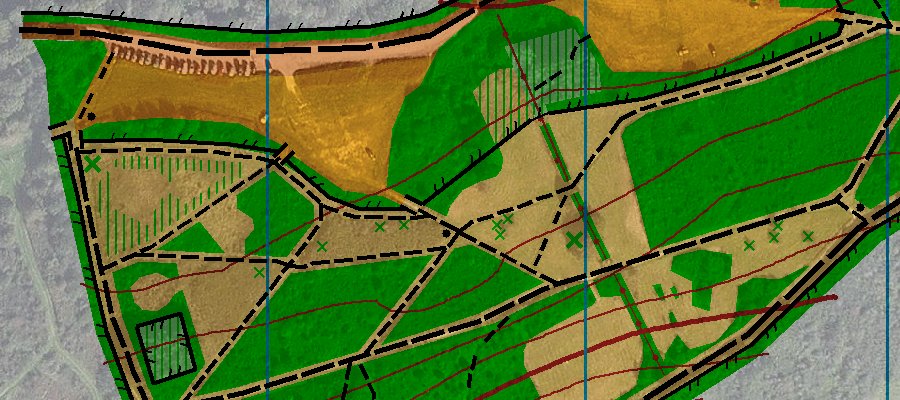
An Ocad vector map overlying a dimmed raster aerial view template
Ocad mappers may be familiar too with the problem of placing a JPEG image on an Ocad map. It's because they're trying to mix raster and vector, chalk and cheese. The latest version, Ocad 11, addresses this by enabling a 'Layout' layer to sit on top of the vector map. It seems to work OK but isn't the smoothest process. No doubt that will soon improve though.
Online Ordnance Survey maps provide an excellent insight into raster/vector differences. Go to the County Council's Dorset Explorer site
http://explorer.geowessex.com/
and select Ordnance Survey as your basemap (second box top right). You can zoom in and out through 15 levels of detail.
The 9 smaller scales show raster maps. You cycle through OS 1:1 million, 1:250k, 1:50k Landranger, 1:25k Explorer and 1:10k. Map resolution is always clear because the map type changes before it starts to pixellate.
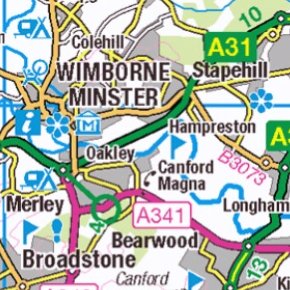
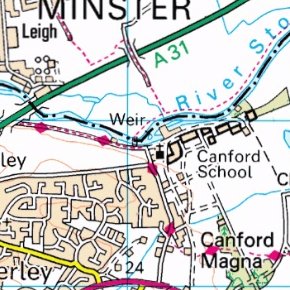
Ordnance Survey 1:250k, 1:50k and 1:25k raster mapping
from Dorset Explorer
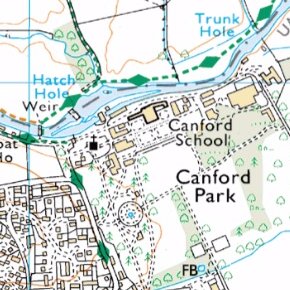
The 6 larger scales all display OS MasterMap which is quite different - it's vector mapping. As you zoom in it's the same map each time, yet it remains well defined. The vector format specifies the points, lines, polygons and text precisely at each level of magnification.
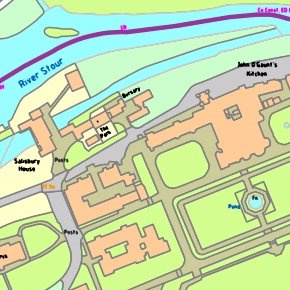
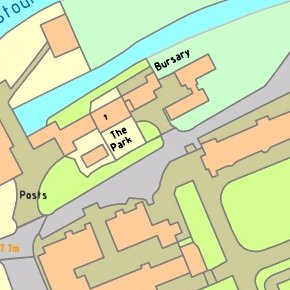
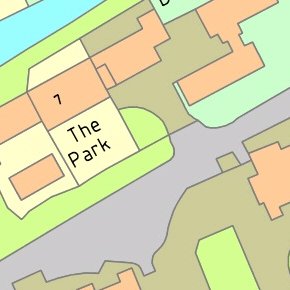
Ordnance Survey MasterMap vector mapping
from Dorset Explorer
I guess 99% of the time the distinction between raster and vector data doesn't matter two hoots, but as computer programmers devise ways to resolve 'never the twain shall meet' it does help to understand new-style mapping software. Layers have been fundamental to GIS for years; they're now an integral part of orienteering programs.
Interesting times lie ahead!
Mike Kite